
Managing the financial health of a small business can feel overwhelming. From tracking cash flow to monitoring expenses, the sheer amount of data to process is enough to make even the most seasoned business owner feel stretched thin. Yet, staying on top of your finances isn’t just important—it’s essential to long-term success.
That’s where a financial dashboard comes in. Think of it as your financial control center: a centralized, visual tool that simplifies complex data and helps you make informed decisions quickly. Whether you’re looking to improve cash flow management, identify inefficiencies, or plan for future growth, a financial dashboard can become your business’s secret weapon.
This guide explores what financial dashboards are, why they matter, the key metrics to track, and how to get started with one.
What Is a Financial Dashboard?
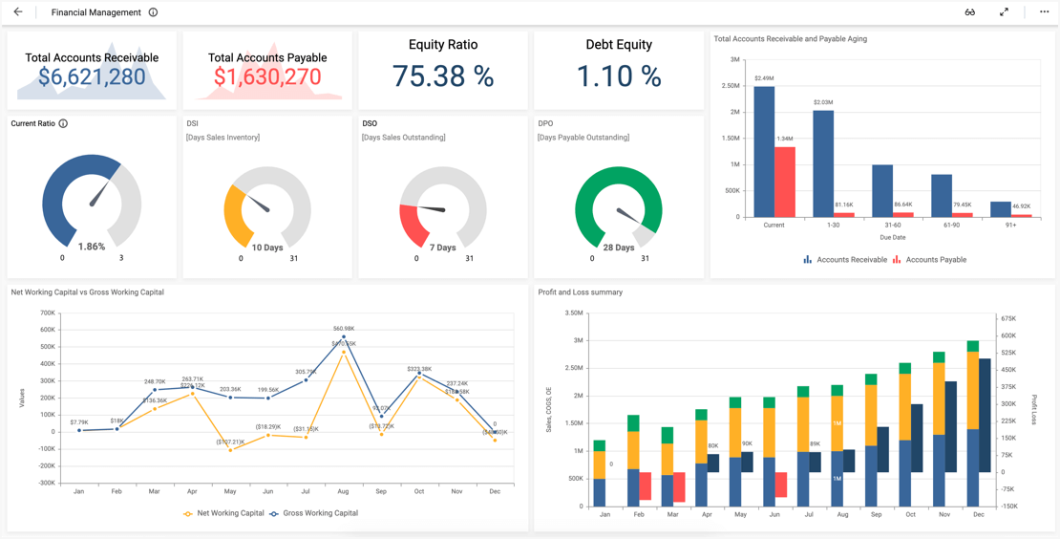
A financial dashboard is a visual representation of your business’s key financial metrics. Instead of poring over spreadsheets or multiple reports, a dashboard consolidates everything you need into an easy-to-read format. With real-time data, charts, and graphs, it provides a clear snapshot of your financial performance.
Key Features of a Financial Dashboard
- Real-Time Tracking: Updates dynamically as your data changes, giving you an up-to-the-minute view of your finances.
- Customizable Metrics: Tailor your dashboard to track the metrics that matter most to your business.
- Ease of Use: Visual tools like charts and graphs simplify complex financial data, making it accessible even for non-accountants.
Example Metrics on a Dashboard
- Revenue vs. expenses.
- Profit margins.
- Cash flow trends.
- Accounts receivable and payable.
By consolidating data in one place, financial dashboards eliminate guesswork, allowing you to focus on growing your business.
Why a Financial Dashboard Matters
1. Real-Time Insights
Traditional financial reports often take time to compile and may only give you a snapshot of the past. A dashboard, however, provides real-time updates, ensuring you’re always aware of your current financial position.
Example: A restaurant owner spots a sudden spike in operational expenses on their dashboard. With this real-time insight, they can immediately investigate and address the issue before it escalates.
2. Better Decision-Making
With all your key metrics in one place, financial dashboards make it easier to analyze data and make informed decisions. Whether you’re evaluating a new investment opportunity or planning for expansion, having accurate data at your fingertips is invaluable.
Example: A retail store sees declining profit margins on one product category. Using their dashboard, they identify high shipping costs as the culprit and renegotiate supplier terms to restore profitability.
3. Time-Saving
Instead of manually compiling data from multiple sources, a financial dashboard automates the process, freeing up time for other critical tasks.
Key Metrics to Include in Your Dashboard
Every business is unique, but certain metrics are universally important for monitoring financial health.
1. Revenue Metrics
- Total Revenue: Tracks overall income from sales.
- Revenue by Product/Service: Identifies top-performing offerings.
- Revenue Growth: Measures month-over-month or year-over-year growth.
2. Expense Metrics
- Total Expenses: Tracks operating costs.
- Cost of Goods Sold (COGS): Measures the direct costs of producing goods or services.
- Operational Expenses: Tracks costs like rent, utilities, and payroll.
3. Profitability Metrics
- Gross Profit Margin: Revenue minus COGS, divided by revenue.
- Net Profit Margin: Profit after all expenses divided by revenue.
4. Cash Flow Metrics
- Cash Inflows and Outflows: Tracks money entering and leaving the business.
- Burn Rate: How quickly cash reserves are being spent.
- Runway: How long your business can operate with existing cash reserves.
5. Accounts Payable and Receivable
- Overdue Invoices: Highlights customers who haven’t paid on time.
- Payment Schedules: Tracks when you owe payments to suppliers.
Visual Idea: Create a simple table with these metrics and their definitions for reference.
Tools to Create and Manage a Financial Dashboard
There are several tools and platforms available to help you set up a financial dashboard, each catering to different needs and levels of expertise.
1. Accounting Software
Most accounting platforms come with built-in dashboard features that are user-friendly and integrate directly with your financial data.
- QuickBooks: Offers customizable dashboards for tracking cash flow, income, and expenses.
- Xero: A great option for small businesses, with real-time dashboards for cash flow and accounts receivable.
2. Dedicated Dashboard Platforms
For businesses needing more advanced analytics, dedicated platforms like these offer robust customization options:
- Zoho Analytics: Provides powerful tools for creating detailed financial dashboards. This is my personal favorite and I have used it for years.
- Google Data Studio: A free, highly customizable tool for visualizing data from various sources.
3. Custom Solutions
If you prefer a hands-on approach, tools like Excel or Google Sheets allow you to build a custom dashboard tailored to your specific needs. However, these requires knowledge of these programs, and (my personal opinion) their full use capacity is only reached when you are near expert user level.
Setting Up Your First Financial Dashboard
Creating a financial dashboard may seem daunting, but breaking it into manageable steps makes it easier.
Step 1: Define Your Goals
Determine what you want your dashboard to achieve. Are you focusing on cash flow? Monitoring profitability?
Step 2: Choose a Platform
Select a tool that aligns with your goals and technical expertise, whether it’s QuickBooks, Zoho Analytics, or a simple spreadsheet.
Step 3: Connect Your Data Sources
Link your dashboard to your bank accounts, accounting software, or CRM to automate data updates.
Step 4: Customize and Test
Tailor your dashboard to display the metrics most relevant to your business. Test it with real data to ensure accuracy.
Step 5: Review and Update Regularly
Your business evolves, and so should your dashboard. Update metrics and refine visualizations as your needs change.
Conclusion: A Must-Have Tool for Small Business Success
In today’s fast-paced business world, having real-time financial insights is no longer a luxury—it’s a necessity. A financial dashboard simplifies the complexities of managing your business’s finances, providing the clarity and data you need to make smart decisions.
By investing the time to set up and maintain a dashboard, you’ll not only save time but also gain confidence in your ability to navigate the financial challenges of running a small business. Start small, stay consistent, and watch how this tool transforms the way you manage your business.